Wednesday, October 27, 2010

Thursday, October 7, 2010
Desktop Application Update
Since Sage uses python, and I have experience using Python/Tk, it made sense to write the desktop application in Python. The project has been codenamed Chamomile and has been imported into our SVN repository. It's still very much a work in progress, but check out the screenshot below.


Thursday, September 30, 2010
Tuesday, September 28, 2010
UPDATE: Sage vs Mathematica
Sage is the winner. Period. It accomplishes the same thing that Mathematica does except it does so for free. Sage is also open source. It appears to integrate nicely with python (as does the Arduino). Since I have experience using Tkinter to build GUIs in python, we should be able to get the desktop application complete on schedule.
Below is a graph I generated using Sage. The data was generated using the (updated) java script I wrote before. Just as in Mathematica, the graph is interactive and can be rotated with the mouse.

Below is a graph I generated using Sage. The data was generated using the (updated) java script I wrote before. Just as in Mathematica, the graph is interactive and can be rotated with the mouse.

Below is the updated java code that generates a sample dataset for Mathematica and Sage.
import java.util.Random;
public class datamake {
public static void main(String[] args) {
Random gen = new Random();
int rdm = 0;
String mathematica = "";
String sage ="";
mathematica += ("ListSurfacePlot3D[{");
sage += ("list_plot3d([");
for(int i = 0; i < 10; i++){
for(int j = 0; j < 10; j++){
if(gen.nextInt() %4 == 0){
rdm = gen.nextInt(5);
mathematica += ("{" + i + "," + j + "," + rdm + "},");
sage += "(" + i + "," + j + "," + rdm + "),";
}
}
}
mathematica = mathematica.substring(0,mathematica.length()-1);
mathematica += ("}]");
sage = sage.substring(0, sage.length()-1);
sage += "])";
System.out.println(mathematica);
System.out.println(sage);
}
}
Saturday, September 25, 2010
Sage vs Mathematica
I found this program called Sage that claims to be an open source alternative to Mathematica. It runs natively in Linux and inside a VMWare virtual machine in Windows. The documentation makes it appear as if Sage will accomplish the same thing we are trying to use Mathematica for. I'm installing it now (about a 20 min process) and I'll post an update later today explaining the outcome.
Thursday, September 23, 2010
Visualizing Data
I sent Dr. Goddard an e-mail explaining how I wanted to create a 3d surface plot using an incomplete data set. He mentioned several solutions, but his first choice was to use Mathematica instead of trying to create a graph using just java. One of my goals was to have the Desktop application be competently free and open source, and relying on Mathematica violates this. However, the solution is so simple and elegant that I'm not going to reinvent the wheel just to keep things open source.
I wrote a quick script to generate a set of sample data
import java.util.Random;
public class datamake {
public static void main(String[] args) {
Random gen = new Random();
String output = "";
output += ("ListSurfacePlot3D[{");
for(int i = 0; i < 10; i++){
for(int j = 0; j < 10; j++){
if(gen.nextInt() %4 == 0)
output += ("{" + i + "," + j + "," + gen.nextInt(5) + "},");
}
}
output = output.substring(0,output.length()-1);
output += ("}]");
System.out.println(output);
}
}
and Mathematica generated this surface plot.

If you look closely a the code, you will notice that it only generates approximately 25% of the data required. The algorithm automatically interpolates the missing data. Pretty sweet huh?
I wrote a quick script to generate a set of sample data
import java.util.Random;
public class datamake {
public static void main(String[] args) {
Random gen = new Random();
String output = "";
output += ("ListSurfacePlot3D[{");
for(int i = 0; i < 10; i++){
for(int j = 0; j < 10; j++){
if(gen.nextInt() %4 == 0)
output += ("{" + i + "," + j + "," + gen.nextInt(5) + "},");
}
}
output = output.substring(0,output.length()-1);
output += ("}]");
System.out.println(output);
}
}
and Mathematica generated this surface plot.

If you look closely a the code, you will notice that it only generates approximately 25% of the data required. The algorithm automatically interpolates the missing data. Pretty sweet huh?
Thursday, September 16, 2010
We Have Sonar!
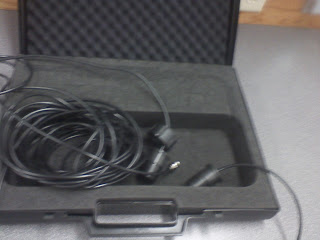
We have acquired 2 marine echosounder transducers complements of Dr. Preston Wilson. They came with very little instruction and documentation and thus, we are having a bit of difficulty interfacing them with the Arduino. However, most of us are smart so I'm sure we'll figure it out. They use standard BNC connectors which makes them easy to test with our lab equipment.

Subscribe to:
Posts (Atom)