Found this handy website
http://www.fcc.gov/mb/audio/bickel/DDDMMSS-decimal.html
Tuesday, November 9, 2010
Monday, November 8, 2010
NMEA Parser update
We have agreed on a protocol for the file that the microcontroller stores on the SD card. The file will contain normal NMEA data, mixed in with depth measurements. Since all NMEA data begins with a '$' sign, the depth measurements are easily singled out. Also, since the GPS only updates one time per second, and we are able to take several depth measurements during that time, the desktop application takes an average of all of the depth measurements taken during the GPS refresh time. The regex that I am using to pull the GPS coordinates is
self.gpgga = re.compile('^\$GPGGA,\d+,(?P\d+\.\d+),[NS],(?P\d+\.\d+),[EW],\d,(?P\d+),.*,(?P\d+\.\d+),M');
self.gpgga = re.compile('^\$GPGGA,\d+,(?P
Thursday, November 4, 2010
NMEA Parser
I wrote some nice code today to parse the NMEA input. We are able to gather latitude, longitude, altitude, and depth data. The code can be found in our svn repository.
Wednesday, October 27, 2010
SD Card socket
I mounted the SD card socket, and necessary resistors, onto a piece of perfboard. Below is the pinout. The pin numbers correspond to inputs on the Arduino for the SD card library we are using.

Below is the schematic

Thursday, October 7, 2010
Desktop Application Update
Since Sage uses python, and I have experience using Python/Tk, it made sense to write the desktop application in Python. The project has been codenamed Chamomile and has been imported into our SVN repository. It's still very much a work in progress, but check out the screenshot below.


Thursday, September 30, 2010
Tuesday, September 28, 2010
UPDATE: Sage vs Mathematica
Sage is the winner. Period. It accomplishes the same thing that Mathematica does except it does so for free. Sage is also open source. It appears to integrate nicely with python (as does the Arduino). Since I have experience using Tkinter to build GUIs in python, we should be able to get the desktop application complete on schedule.
Below is a graph I generated using Sage. The data was generated using the (updated) java script I wrote before. Just as in Mathematica, the graph is interactive and can be rotated with the mouse.

Below is a graph I generated using Sage. The data was generated using the (updated) java script I wrote before. Just as in Mathematica, the graph is interactive and can be rotated with the mouse.

Below is the updated java code that generates a sample dataset for Mathematica and Sage.
import java.util.Random;
public class datamake {
public static void main(String[] args) {
Random gen = new Random();
int rdm = 0;
String mathematica = "";
String sage ="";
mathematica += ("ListSurfacePlot3D[{");
sage += ("list_plot3d([");
for(int i = 0; i < 10; i++){
for(int j = 0; j < 10; j++){
if(gen.nextInt() %4 == 0){
rdm = gen.nextInt(5);
mathematica += ("{" + i + "," + j + "," + rdm + "},");
sage += "(" + i + "," + j + "," + rdm + "),";
}
}
}
mathematica = mathematica.substring(0,mathematica.length()-1);
mathematica += ("}]");
sage = sage.substring(0, sage.length()-1);
sage += "])";
System.out.println(mathematica);
System.out.println(sage);
}
}
Saturday, September 25, 2010
Sage vs Mathematica
I found this program called Sage that claims to be an open source alternative to Mathematica. It runs natively in Linux and inside a VMWare virtual machine in Windows. The documentation makes it appear as if Sage will accomplish the same thing we are trying to use Mathematica for. I'm installing it now (about a 20 min process) and I'll post an update later today explaining the outcome.
Thursday, September 23, 2010
Visualizing Data
I sent Dr. Goddard an e-mail explaining how I wanted to create a 3d surface plot using an incomplete data set. He mentioned several solutions, but his first choice was to use Mathematica instead of trying to create a graph using just java. One of my goals was to have the Desktop application be competently free and open source, and relying on Mathematica violates this. However, the solution is so simple and elegant that I'm not going to reinvent the wheel just to keep things open source.
I wrote a quick script to generate a set of sample data
import java.util.Random;
public class datamake {
public static void main(String[] args) {
Random gen = new Random();
String output = "";
output += ("ListSurfacePlot3D[{");
for(int i = 0; i < 10; i++){
for(int j = 0; j < 10; j++){
if(gen.nextInt() %4 == 0)
output += ("{" + i + "," + j + "," + gen.nextInt(5) + "},");
}
}
output = output.substring(0,output.length()-1);
output += ("}]");
System.out.println(output);
}
}
and Mathematica generated this surface plot.

If you look closely a the code, you will notice that it only generates approximately 25% of the data required. The algorithm automatically interpolates the missing data. Pretty sweet huh?
Thursday, September 16, 2010
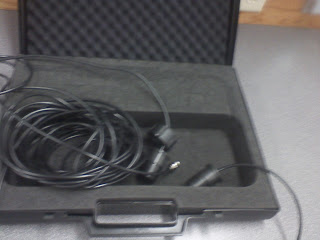
We Have Sonar!
We have acquired 2 marine echosounder transducers complements of Dr. Preston Wilson. They came with very little instruction and documentation and thus, we are having a bit of difficulty interfacing them with the Arduino. However, most of us are smart so I'm sure we'll figure it out. They use standard BNC connectors which makes them easy to test with our lab equipment.

Boat Body Construction
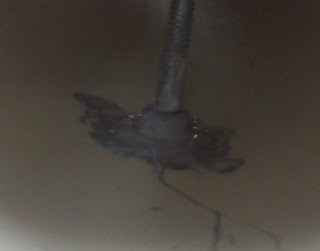
The basic boat body is complete. The body consists of 2 pieces of PVC pipe that are 30 inches in length and 4 inches in diameter. The pontoons are attached by a platform made of plywood that has been covered with acrylic on one side. The reason for the acrylic is to provide a non-porous surface for us to create a sealed, waterproof housing for our electronic equipment.
Below is an image of the inside of one of the pontoons. You can see the bolt protruding through the PVC pontoon. This bolt, which is secured with a washer and nut, secures the platform to the pontoon. The hole in the pontoon that the bolt passes through has been sealed with marine epoxy to ensure that the pontoon remains waterproof.


Below is an image of the inside of one of the pontoons. You can see the bolt protruding through the PVC pontoon. This bolt, which is secured with a washer and nut, secures the platform to the pontoon. The hole in the pontoon that the bolt passes through has been sealed with marine epoxy to ensure that the pontoon remains waterproof.


Tuesday, September 7, 2010
Visualizing Data
Since we have yet to acquire a sonar, I have been developing a set of test data to use to test the software. In order to create a mathematically realistic lake (ie. a lake where the depth changes are gradual) I visualized the lake as a set of XYZ coordinates. X and Y are evenly spaced, and I let Z = ABS(SIN(X)) which creates a gradual, psudo-realistic contour for the bottom of the lake and keeps Z values between 0 and 1.
Below is a screenshot of the 3d graph I was able to make in excel.
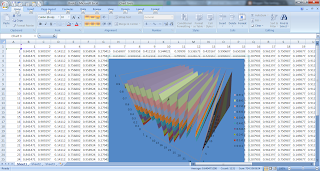
If we can manage to use the data that we collect to come up with evenly spaced X and Y points (easy through interpolation, weighted averages, etc...) we should be able to generate these graphs easily. We could even use OLE controls to make the process transparent to the end user (of course this would require the user to have excel and windows installed, and we'd have to use ruby or something because Java doesn't support OLE to my knowledge).
Sunday, September 5, 2010
Home Depot and Flotation Test
The entire group made a run to Home Depot on Sunday, August 29th. We purchased the following:
- Aqua Epoxy (for waterproofing)
- 4" diameter 10' length PVC pipe (boat pontoons)
- 4 4" diameter removable cover fittings (caps for pontoons)
- Wooden platform
- Assorted nuts, washers, and bolts
Using these supplies we will be able to build a simple boat body for initial testing of components.
Before selecting the PVC pipe length and diameter we did a few simple load calculations. The max load for a length of PVC pipe is given by this equation:
maxLoad = pi * radius^2 * length * (mass of water per unit volume)
This equation basically states that the maximum load of the pipe is equal to the mass of water being displaced by the pipe while fully submerged.
The PVC pipe we purchased can hold a maximum load of about 54 pounds (22 pounds if we use only half of the pipe).
After purchasing these supplies we did an initial flotation test in a pool, as can be seen in the embedded video below. This test was successful.
Saturday, September 4, 2010
Acquired some batteries
We found 2 UB1280(datasheet) batteries laying around in the machine shop. Daryl gave us permission to take them for the semester. They are only 8Ah but they should be perfect. A measurement with a volt meter shows that they are holding a charge at about 12.41 V which indicates that they should be relatively healthy.
We still need a way to charge these batteries. I was looking at building this battery charger. At first, it seems completely ridiculous, but after doing a bit of research, I think it may work. The advantage it the cost is low (the article says $3, I think it will be closer to $10) but there is no overcharge protection so we will either have to incorporate a timer, an Arduino controlled auto-shutoff, or take constant measurements during charging.
While these batteries are not ideal (very heavy, smaller capacity than desired), they were free, and they work so this is a good find!
Wednesday, September 1, 2010
Choosing a battery
I've been researching VLRA batteries. This type of lead-acid battery can safely be inverted without damaging the battery by spilling electrolyte. There is also a safety valve that will vent built up hydrogen gas should we overcharge the battery. While our application is weight sensitive, and these batteries are exceptionally heavy (the one I'm contemplating purchasing weighs about 8 pounds), the power to cost ratio is very high. Since we are on a budget, lead-acid is a better solution than, say, Li-Ion or lithium polymer. The battery I selected, which is intended for use in wheelchairs and UPSs, should be able to be discharged(to about 10%) and recharged many many times. The data sheet specifies the dimensions and charging specifications as well.
Sunday, August 29, 2010
We're On Google Code
The desktop application for The Santiago Project is officially a google code project. You can view the project page at http://thesantiagoproject.googlecode.com and checkout the code from our subversion repository with the following command:
svn checkout http://thesantiagoproject.googlecode.com/svn/trunk/ thesantiagoproject-read-only
Monday, April 26, 2010
Friday, April 16, 2010
Introduction to The Santiago Project
Welcome to The Santiago Project blog!
The Santiago Project is a collaboration of four undergraduate electrical/computer engineering (ECE) students studying at the University of Texas at Austin. This is our senior design project, which was begun during spring 2010 and will be completed during fall 2010.
The name of our project refers to the main character of The Old Man and the Sea, written by Ernest Hemingway in 1951.
The senior design sequence at the University of Texas consists of two courses: EE364D and EE464K. Typically EE364D is taken during the spring semester of a student's junior year, and EE464K is taken during the fall semester of senior year. At the time of this post we are in the latter half of EE364D.
In senior design we form groups of three to five students to work together for the entire sequence. We must then decide on a project; this project must consist of both hardware and software components and be complicated enough to give us real work for the entirety of senior design.
Our group consists of the following students:
- Josh Arenson
- Marc Anthony Gonzalez
- Cory Heuschkel
- Matthew Juran
Thank you for reading!
Concept sketch of the UMV
This is a concept sketch of what the watercraft should look like. Obviously, parts of it are exaggerations/comic relief, but this is the general idea.

UPDATE: Converting GPS Serial Output to TTL levels
I ordered a sample ADM232A which is a high-speed CMOS RS-232 Driver/Receiver. The chip was designed to take an RS232 signal and convert it to TTL levels and vice-versa. While our implementation using a rail-to-rail op-amp worked, the ADM232A is specifically designed to handle this task. I wired the circuit as shown below.

Using a function generator, I provided a 12 V peak-to-peak signal at 4800 Hz (the same signal as the output from the GPS we are using) as a simulated RS232 input. The output signal was from 0 - 5 V and inverted. The oscilloscope measurement can be seen below. The blue line is from the function generator, and the yellow line is output from the ADM232A.

Overall, I would recommend that we use the ADM232A instead of the op-amp solution. The ADM232A has very low power requirements (as configured, I measured the current draw between 2 - 3 mA), and it was made specifically to solve our RS232 - TTL voltage issue.
Monday, April 5, 2010
Converting GPS Serial Output to TTL levels
Not realizing the output voltage of the GPS we are using, I wired it directly up to our new Arduino. After three hours of it not working, it occurred to me that the voltage output may be at RS232 levels (plus or minus 3 to 15 volts) instead of TTL (0 through 5 volts) levels. A quick check on the oscilloscope confirmed that the Garmin unit we are using outputs at plus and minus 6 volts. I ordered a sample of an ADM232 which converts between RS232 levels and TTL levels. Temporarily, we are using an OPA2350 rail to rail op amp to limit the output from 0-5 volts. This solution works, and we are now able to read NMEA data through the Arduino.
Here is the schematic of the circuit that we are using:

Here is the schematic of the circuit that we are using:

Desktop Application Concept Screenshots
These are screenshots of how I envision the desktop application.


Tuesday, March 9, 2010
Reading NMEA data from the Garmin 76CSx
Knowing that the Garmin 76CSx is capable of outputting NMEA data, I needed to figure out how to obtain such data in a way that is easy for a microcontroller to process. The 76CSx has 2 ports on the back: a USB port, and a proprietary serial port. Without any modifications, ussing PuTTY to establish a connection via USB failed. The reason for this is USB is, although a serial connection, is not a true serial port. A workaround to this problem is to use a program from Garmin called Spanner. Spanner creates a virtual serial port from a USB port, and allows a terminal session to send/receive data over USB. Although Spanner is not officially supported by Garmin for use with the 76CSx, it worked perfectly and NMEA data instantly filled my terminal window. While this established that it was possible to read NMEA data from the unit, it does not meet my requirement of being able to read the data from a microcontroller as Spanner requires Windows to run. The obvious solution would be to try reading from Garmin's proprietary serial port, but the cable is $40! Before I spend any kind of money on a glorified (simplified actually, the Garmin connector is only 4 pins) RS232 cable, I wanted to make sure that I could get the data I needed from the serial port.
Using the diagram below, I attached the 76CSx to a logic analyzer.

The waveform I captured is below.
 The way NMEA data is formatted dictates that each command should begin with a dollar sign followed by a name identifier that is specific to the type of device; thus, the first 3 characters of each message should have been "$GP" without the quotes. Translated form ASCII to binary, the expected result is "0010 0100 X 0100 0111 X 0101 0000 X" where "X" is a stop bit. If you take the time to analyze the output from the logic analyzer, it does not appear that I received the correct data at all. There may be something I don't know about this type of serial connection; for example, the data may be sent last bit first, or I my waveform may be from the middle of a command etc.
Since I was encouraged that SOME kind of data was being output, Matt and I decided to fashion a very crude Garmin -> RS232 cable (not anything close to a permanent solution, we literally held the wires with our fingers), and see what happened. The attempt was successful and once again, I saw a terminal window fill with, what appeared to be, valid NMEA data.
(Pictures soon to follow)
Knowing that we could now use the Garmin serial connection, I decided to make a more permanent Garmin -> RS232 cable. I found a website that will send you a custom made, injection molded, silicon connector for any Garmin model, as long as you promise to send them some form of compensation The average user sends a paypal payment of $10, but they will accept other amounts. (tangible goods are also accepted). I ordered 2 plugs and will document the construction of my cable when they arrive.
Thursday, February 25, 2010
Delaunay's TIN - Triangulated Irregular Network
I'm running into some problems with the mapping visualization software. I think we need to use a TIN algorithm. This page looks to be useful.
EDIT: The algorithm used on this page is O(N*N) and thus, for any reasonable amount of points (I'm trying to get 400 to work right now) the program takes a large amount of time to run.
UPDATE: I was generating my test data set with Z values randomly generated between 0-2^64 which is why it took so long. I reduced the Z range from 0-50 and the program generated a 3-D map of 400 points in under 5 seconds.

The code that I used.
Friday, February 19, 2010
NMEA 0183
NMEA 0183 (or NMEA for short) is a combined electrical and data specification for communication between marine electronic devices such as echo sounder, sonars, anemometer (wind speed and direction), gyrocompass, autopilot, GPS receivers and many other types of instruments. It has been defined by, and is controlled by, the U.S.-based National Marine Electronics Association.
Link to the wikipedia article.
Arduino NMEA device driver library.
Link to the wikipedia article.
Arduino NMEA device driver library.
How to get VTK working in Eclipse
EDIT: These links seem to be down. This is bad.
Although I mentioned in this post that VTK was too complex and powerful for what we needed, I have decided that it might be a viable option after all. I was able to get it working in eclipse using the following process.
Thanks to the guys at http://dev.artenum.com/ for most of this information.
1. Download the latest Cassandra release from here.
2. Run the installer.
3. Open a project in eclipse
4. Add vtk.jar to your build path
Thanks again to http://dev.artenum.com. Original article.
Although I mentioned in this post that VTK was too complex and powerful for what we needed, I have decided that it might be a viable option after all. I was able to get it working in eclipse using the following process.
Thanks to the guys at http://dev.artenum.com/ for most of this information.
1. Download the latest Cassandra release from here.
2. Run the installer.
3. Open a project in eclipse
4. Add vtk.jar to your build path
- right click on the root project
- click 'properties'
- click 'libraries'
- click 'add external jar'
- Add 'vtk.jar' which can be found in '\Cassandra\thirdpart\vtk5.0-32b\bin'
- click the drop-down arrow next to the green run button
- click 'Run Configuration'
- In the right hand pane, expand 'Java Application'
- choose your project
- click the 'environment' tab
- click 'New' to create a new environment variable
- name the variable 'PATH'
- set its value to the absolute path (include drive letter etc...) of '\Cassandra\thirdpart\vtk5.0-32b\bin'
Thanks again to http://dev.artenum.com. Original article.
Wednesday, February 17, 2010
Problem Statement - Final Draft
Problem Statement - The Santiago Project.docx
(Please download and open with Microsoft Word, Google Docs ruins the formatting.)
(Please download and open with Microsoft Word, Google Docs ruins the formatting.)
RESEARCH: Processing Libraries to Generate 3D Maps
- SurfaceLib
- Pros
- Seems very powerful
- Easy to apply textures to a 3D surface
- Cons
- Very complex
- Spherical coordinates?
- SuperPoint
- Pros
- Very easy to use, arguments consist of x,y,z,R,G,B,A
- Renders very fast
- Cons
- Too simple
- Cannot apply textures
- Patchy
- Pros
- Powerful
- Easy to apply textures
- Cons
- Somewhat of a learning curve
- Briefly looked at VTK
- Seemed EXTREMELY powerful (they boast that the program has over 1 million SLOC)
- Seemed EXTREMELY complex
- Little documentation
Desktop Application Research
- Evaluating the programing language "Processing"
- Processing Kicks Ass
- Easy to generate 3D models
- 3rd party library supports direct serial communication with embedded device (Arduino is mentioned specifically)
- Can automatically export the program as a java applet so that it can be viewed in a browser
Tentative Project Flowchart
Link to a PDF of a tentative project flowchart.
This flowchart illustrates how I think the components should interact with each other if we use the control system that I described in this post.
This flowchart illustrates how I think the components should interact with each other if we use the control system that I described in this post.
Possible Contol System Components
Arduino USB Board
ArduPilot - Arduino Compatible UAV Controller w/ ATMega328
20 Channel EM-406A SiRF III Receiver with Antenna
Official Ardupilot FTDI Cable
- Used as the central microcontroller of the boat
- Open source hardware
- Open source software
- Very large community support
- Wide range of accessories
- Low cost ($30)
- Link to page at sparkfun
ArduPilot - Arduino Compatible UAV Controller w/ ATMega328
- UAV controller for use in unmanned cars, planes, and boats
- Plugs directly into the Arduino microcontroller
- Comes with an unmanned vehicle operating system that is FOSS
- Has an socket for a GPS receiver
- Low cost ($25)
- Link to page at sparkfun
20 Channel EM-406A SiRF III Receiver with Antenna
- GPS receiver used with ArduPilot
- Antenna included
- Small form factor
- 1 Hz update rate
- 5 Volts
- Very well documented
- Link to page at spakfun
Official Ardupilot FTDI Cable
- Needed to load firmware, etc... on the ArduPilot board
- $20
- Not worth it to make our own, I looked into it
- Lab checkout doesn't have one either
Subscribe to:
Posts (Atom)